Technology IPO Review 2011 to 2015
Financial markets are ever-changing. The U.S. technology IPO market is no exception.
Given the current IPO market doldrums (March 2016) and my recent prediction of a Q2 rebound, it might be helpful to look back and see how the IPO market has changed in recent years.
Technology IPOs – From 2011 to 2015
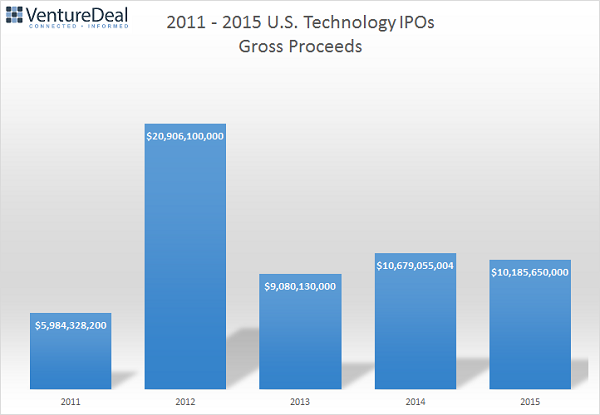
In 2011, the tech IPO market raised nearly $6 billion in aggregate gross proceeds.
In addition to Life Sciences and Software-enabled firms, companies went public in the hardware-oriented industries of Alternative Energy, Components, Mobile, Transportation and Wireless.
In 2015, only two hardware-oriented industry companies outside of Life Sciences had an IPO, yet the market had grown to $10.2 billion in gross proceeds.
Between 2011 and 2015, the number of technology IPOs also increased dramatically.
In 2011, there were 36 tech IPOs allocated between 15 different industries.
The two years of 2014 – 2015 averaged 79 IPOs each year, between 15 industries.
This result represented more than double the number of IPOs each year when compared with 2011, just three years earlier.
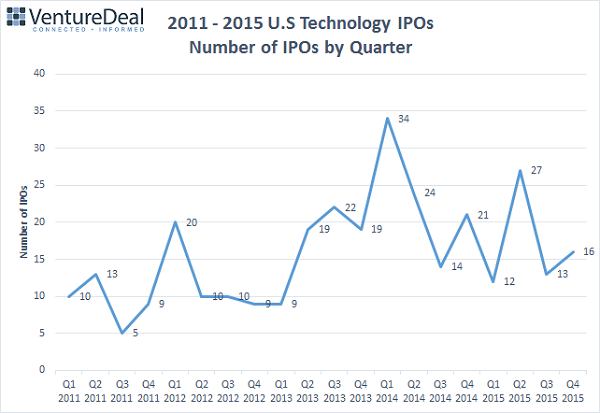
2013 was a pivotal year resulting in a significant increase in the number of tech IPOs. In 2011 to 2012, the chart shows a low-end range of 5 to 9 IPOs per quarter and a high-end range of 13 to 20.
However in 2013, the lowest IPO activity quarter was 9 and the highest ranged from 19 to 22. In 2014 and 2015, the low-end number of IPOs was 12 and the high-end range was from 16 to a high of 34 IPOs per quarter.
Life Sciences 2013 - 2015
So, what changed in 2013 that led to a significant increase in the number of successful offerings?
Life Sciences. Starting with Q2 2013, Biotechnology, Pharmaceutical and Medical Device companies starting going public at a much greater rate than before.
The Number of IPOs by Quarter chart above illustrates the Q2 2013 inflection point and the table below shows the same data detailed by industry and year, with increased IPO trends highlighted in green, no trend in yellow and fewer IPOs in red:
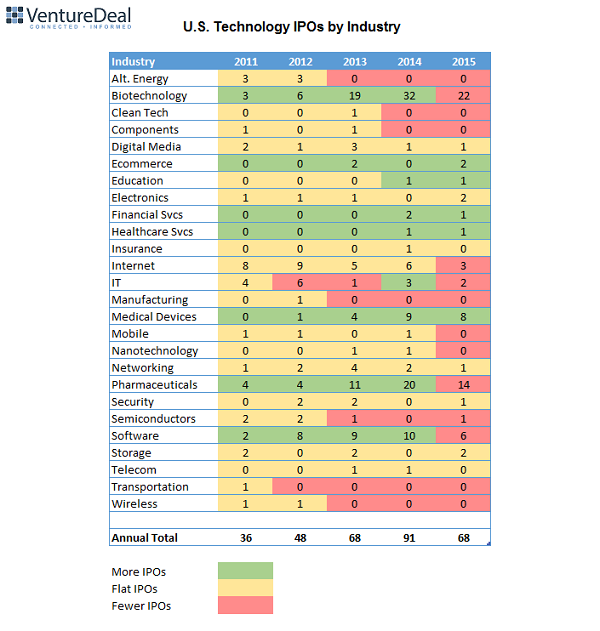
The color-coded table above shows that the number of Biotechnology, Pharmaceuticals and Medical Device IPOs leapt by 300% in 2013 and largely continued at those elevated levels throughout 2014, with some tapering off during 2015.
This Life Sciences ‘surge’ accounted for the significant increase in the technology IPO market activity over the five year period.
Average IPO Size Remains Flat
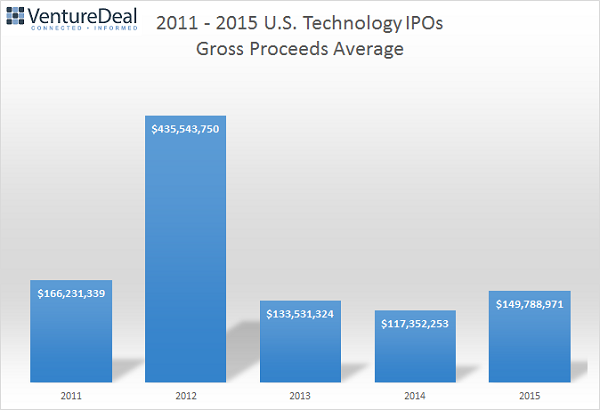
Interestingly, the chart below indicates the average size of IPO gross proceeds has remained largely unchanged over the past five years, if not slightly lower vs. 2011, setting aside the anomalous Facebook (FB) IPO in 2012 which skewed the results for that year.
Pricing Visibility Improves, But At A Cost?
Selling the shares of an IPO is an art. The issuer presents its offering to prospective institutional buyers on its “road show” and hires outside firms known as “book-runners” to close the sale at the highest possible price.
As part of this process, the issuing firm usually provides a “range” that it expects to price or sell the IPO shares. This is partly an expectations game and partly a market demand forecasting process.
The chart below shows that over the past 5 years, the number of U.S. technology IPOs that have priced (sold shares) within their expected range, the blue line, has increased as a percentage of all IPOs.
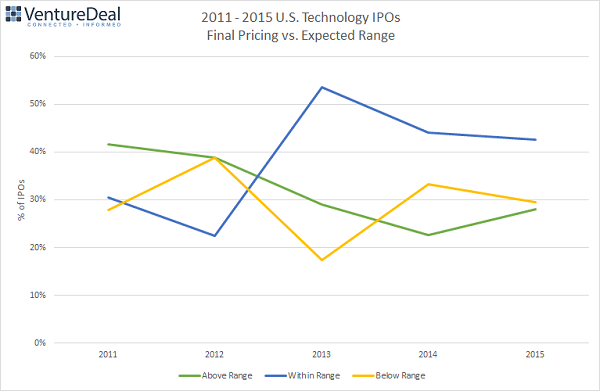
Furthermore, the number of IPOs that priced below their expected range was the same in 2015 as in 2011.
However, the number of IPOs that have priced above their expected range has fallen. It appears that the increase in IPOs pricing within their expected range has come at the expense of fewer IPO surprises to the upside.
Context and Commentary
The average size of a Life Sciences IPO during the five year period was $73.1 million vs. $188.3 million for that of a general technology IPO (ex-Facebook).
Hence, general technology IPO gross proceeds averaged 2.5 times the typical Life Sciences IPO, even stripping out the Facebook IPO.
So while Life Sciences IPOs accounted for a much greater number of deals during the last three calendar years, general technology deals accounted for a higher typical deal size.
General technology deal mix also morphed into a greater number of IPOs for 'software-enabled' firms. I define software-enabled as the following industries:
- Digital Media
- Ecommerce
- Education
- Financial Services
- Internet
- IT
- Mobile
- Security
- Software
- Storage
These software-enabled industries together accounted for 114 IPOs over the five year period, with gross proceeds totaling $39 billion ($23 billion ex-Facebook).
Thus all software-enabled IPOs accounted for 70% of gross proceeds and 36% of the number of IPOs.
Life Sciences IPOs accounted for 159 IPOs, 51% of total, and gross proceeds of $11.6 billion, or 21% of the total.
So while Life Sciences IPOs accounted for a greater number of deals, general technology deals accounted for a much higher deal size.
Why did this occur?
For Life Sciences firms, advances in information technology have resulted in a shorter research-to-discovery cycle, and reducing risk.
At the same time, Big Pharma firms continue to see patent expirations for their treatment portfolios, placing an ever-increasing burden of acquiring next generation technologies.
Life Science firms typically view going public as primarily another financing round, usually to propel their lead candidate(s) through mid- or later-stage trials. This explains the lower IPO amounts raised vs. general technology firms, which frequently raise public funds to “cash out” their investors in addition to raising working capital.
General technology companies going public in the past few years also have significant revenues, unlike those of the “dot com” IPO boom in the late 1990s. Many of those companies had little or no revenues, whereas today’s general tech IPO candidate typically has a $50 million annual revenue run rate.
The quality of general tech company revenues is also much greater than in previous cycles, with the advent of SaaS companies requiring a laser focus on healthy financial metrics that more clearly differentiate the winners from the losers.
The Way Forward
So while the IPO market will take time to adjust to the new reality of fewer late-stage private technology companies being true “unicorns”, the painful adjustment period will be temporary. Private market valuations will come into line again with public appetite for shares of companies with quality earnings and growth rates.